Multi-level drill-down reports that answer the WHY
Uncover root causes faster than ever before

150+ enterprises trust Clootrack


What makes us unique ?

Smart metrics
Track trends with custom or out of the box aggregate metrics that matter.

Compare & segment
Compare and segment data using any parameter you choose.

Role based
Give each role exactly the insights they need to make data-driven decisions.

Fast & intuitive
Handle massive datasets without breaking a sweat.

Easy data export
Download charts and raw data with just a click.

Make it yours
Customize everything - from layouts to metrics to visualizations.

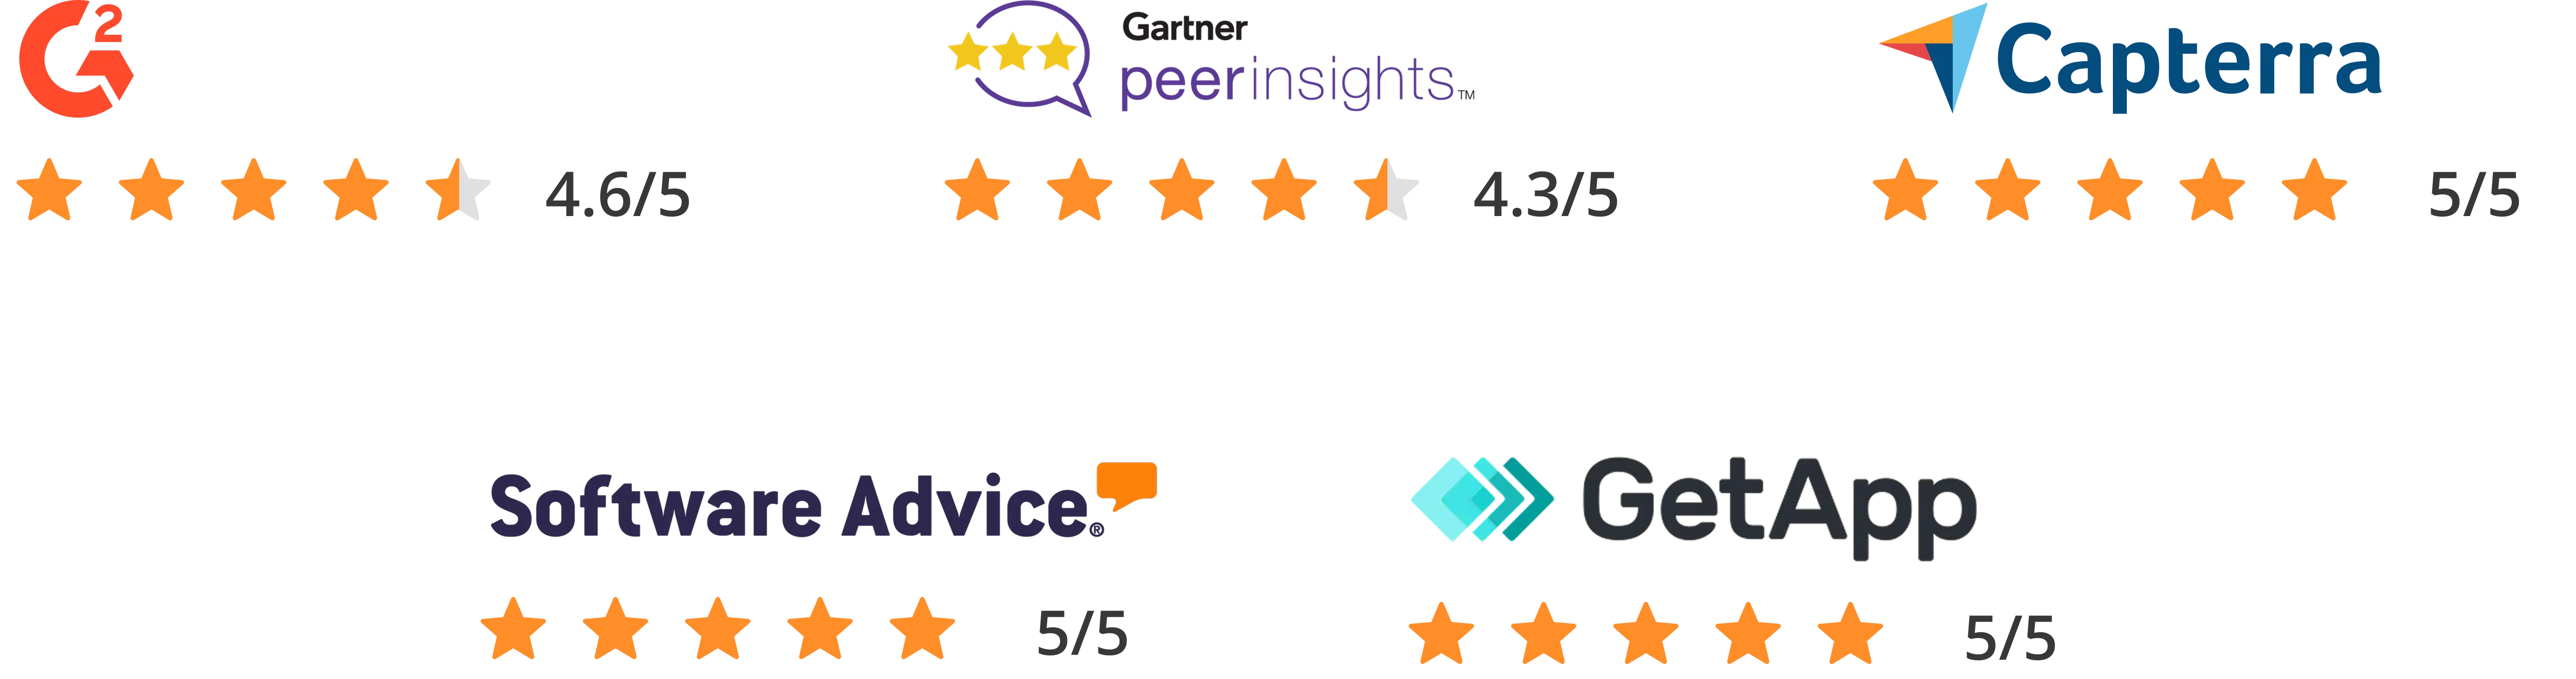
Loved and trusted by users
Highly rated for decision-ready Voice of the Customer insights

Customer
Experience
Experience

NPS
Customer
Experience
Experience
Trusted
Vendor
Vendor
Customer
Satisfaction
Satisfaction
Customer
Engagement
Engagement


“It is the first port-of-call for understanding main category drivers, key sub-themes, and competitive performance of brands in the category. The new graphing capabilities allow quick presentation of key data, and the dashboard interface is easy to understand and use. As a strategy consultant, Clootrack is my usual go-to for a quick and remarkably detailed overview of the category and brands without investing in time-consuming and expensive primary consumer research."
.svg)
Anustup Datta
Director

Are your reports letting you down in meetings?
Navigate to the 'why' behind every insight
Data visualizations that pack a punch
Fully customizable to tell your story


Zero setup headaches - we do all the work
It's all managed for you. Read about it here.
Is your reporting missing what management really wants?
Frequently asked questions (FAQs)
How deep can I go with drill-downs? Is there a maximum number of levels?
You can create as many levels as you need, though we recommend keeping it to 5 or fewer for the best user experience.
Can I customize how the drill-downs work? Like creating my own hierarchies?
Absolutely! You have complete flexibility to create any drill-down hierarchy that fits your needs.
Can my team work on the same drill-down analysis at the same time?
Yes! Multiple team members can collaborate on the same analysis simultaneously.
What kind of charts and graphs can I use in my drill-downs?
You've got 24 different chart options to choose from at any level of your drill-down analysis.
Can I export data from any drill-down level, or am I limited to just the top view?
You can export data from any level you're working in - no restrictions.
How does the system handle large datasets? Does it slow down as I drill deeper?
Our platform is built to handle big data smoothly. Plus, our support team helps optimize your complex calculations to ensure snappy performance at every level.
Can I mix drill-downs with other views like cross-tabs and matrices?
You bet! Feel free to combine drill-downs with any other type of view.
Is it hard to learn? How long will it take my team to get up to speed?
It's pretty straightforward - the interface is intuitive, and we've built in helpful directions right in the dashboards to guide you along.