
Product Category Analysis Process
What are the stages of product category analysis?
Product category analysis is a process that involves breaking down unstructured data for further examination. The whole process includes collecting raw data from several sources to convert it into useful insights for marketers, brand managers, and all other decision-makers.
The category analysis process typically consists of six stages:
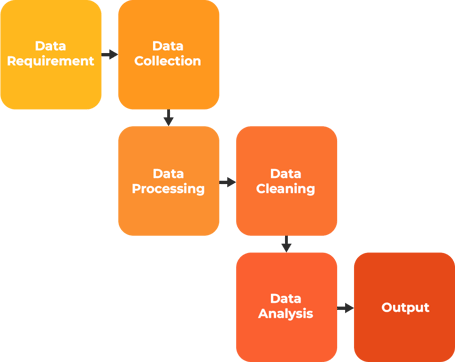
Step 1: Data requirements
In this stage, determine what type of data is required and the level of detail required for the product category analysis to achieve the objective of the analysis. To start, go from general to specific in gathering data requirements. With the initial focus of defining the overall process flow with a skeletal framework, move towards adding more specific and detailed requirements. Broadly, data requirements consist of details such as:
- Sources of data – internal or external to the organization
- Period – 1 year, 1 month, 1 quarter
- Frequency – Daily, monthly, quarterly, yearly
- Number of brands – Other competing brands in the market
- Outcome – Category Drivers, trends, quarterly comparisons, positive opinions, negative opinions
When the requirement is well established, the outcome will be complete in all aspects without having to go back to generating the report repeatedly.
Step 2: Data Collection
in this stage, the customer conversations are extracted by data crawling. Customers express their opinions on multiple platforms like online (social media, forums, review sites, etc.) and customer care tickets. These unbiased conversations contain valuable insights into market trends and product expectations. Every time a consumer likes a post or engages your brand, calls your customer care department, or chats with your chatbot – that’s a data point that becomes the raw data for your category analysis.
Web scraping tools are specially developed software that is used for extracting useful information from online forums and freely available data sources. Other internal sources of the organization, such as sales data and customer queries, have rich information that can be utilized for the analysis.
Step 3: Data Processing
In this stage, extracted data should be arranged and organized in a way that makes analysis easier. The customer conversations from various sources should be grouped into the right product category to ensure that they all belong to the same product or service. Identify the topics and sub-topics that are spoken, and establish the relationship between different topics.
Step 4: Data Cleaning
In this stage, the data that is collected – everything might not be useful to your analysis. Hence it should be cleaned. The data may contain duplicate records, white spaces, or errors. Hence data should be cleaned and kept error-free. This phase must be completed before data analysis starts to get better accuracy and to be closer to your expected outcome.
Step 5: Data Analysis
Once you have a broad group of topics and sub-topics, data analysis is performed to extract product insights and market insights from this rich data source. Mathematical formulas and models, which are also called algorithms, are applied to the processed data to establish relationships among the variables.
In this step, customer conversations are grouped into main topics and sub-topics based on their relationships at multiple levels. When this information is ready, the different topics and sub-topics should be evaluated to rank the relative importance of each topic and sub-topic.
There are a few popular models for measuring customer satisfaction, such as the MoSCoW method, Kano model, RICE, Eisenhower matrix, and Value vs. Complexity/Effort matrix. Each model has its pros and cons. These models allow product managers to extract greater insights from customer experiences, thereby arriving at the category drivers and emerging trends.
Step 6: Output
The final stage of category analysis is the output stage. Here the outcome of the data analysis is presented as insights using textual and visual formats. With the increased use of computer software and various tools such as presentations and excel sheets, it has become easier to present the findings in different formats.
The category analysis report is presented with details relating to category drivers, brand equity, and emerging trends. Details about the positive and negative customer opinions are presented, which gives additional information about each of the product categories. The main outcome of the key elements that form part of the category analysis report is discussed further in this article.
What are the Key Elements of Category Analysis?
.png?width=691&height=299&name=image-png-Jan-19-2023-06-38-07-4920-AM%20(1).png)
1. Category Drivers:
Product category drivers help product managers to understand thoroughly what prompts consumers to use their products and what are the crucial barriers that prevent them from further embracing their offerings.
For example, Clootrack performed analysis for 29 top hotels in the US; the insights report revealed the top drivers in which the first category driver was staff behavior, and this ranked higher compared to location or cleanliness.
These insights derived from category analysis help brand managers to focus on the most important category drivers.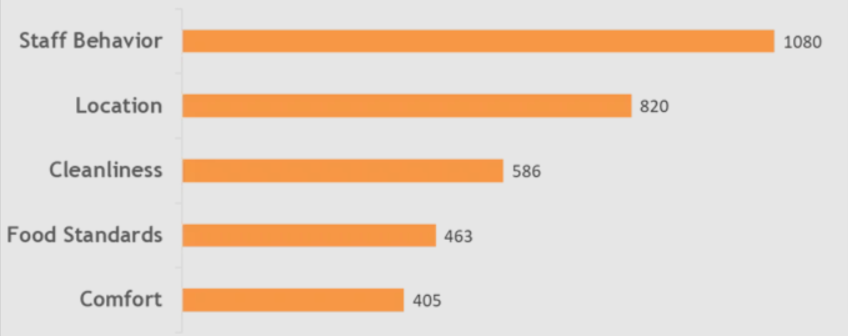
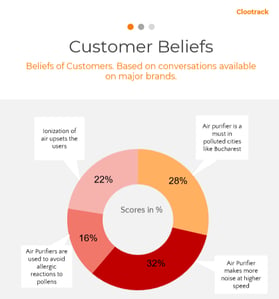
2. Consumer Beliefs:
Consumer psychology is way too complex and non-predictive. However, it is of the greatest importance for marketers to decode the mind of the consumer to learn what is going on in their minds before they make the purchase decision. This is made possible by product category analysis that uses consumer conversations to dig deeper into customers' expectations. Brand managers and insights managers can make use of the customer's beliefs to tap into the potential market for their products.
See how customers of air purifiers believe that “Air Purifier makes more noise at higher speed”. Many consumers have noticed that air purifiers are quiet at low fan speed, but as the speed increases to full blast, the noise level is quite high. Consumers are pushed to leave the fan running at a low speed to eliminate the background noise while they fall asleep.
This is a great insight for a brand manager who can immediately take charge of the situation as it can be translated into a product improvement and, if marketed well, can take the brand ahead of all its competitors in the market.
3. Category Trends:
Customers create trends. Brand managers should be quick enough to capture customer expectations when customers are expressing themselves on various forums about the new experiences they would like to see in a particular product. It is captured as a key element during the category analysis process.
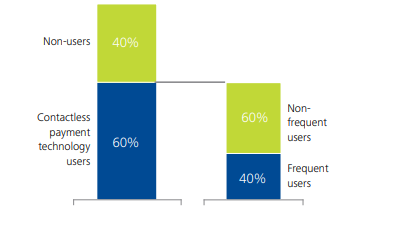
For example, in one of the case studies on Contactless payment and wearables in Australia, it was noticed that Australians were looking forward to adopting wearables and embracing the use of contactless payment technology. Customers expected that they would experience seamless payment options using smartwatches and wearable technology. This emerging trend enabled FinTech companies to create innovative payment solutions.
By 2013, almost 60% of Australians had a contactless card. Among this group, 40% are frequent users of the technology.
Product category analysis ensures to capture the of emerging trends – upcoming features that customers wish to see in a product.
4. Brand Equity
Brand equity is a key component of the category analysis. Brand equity is like the public’s brand valuation and depicts the consumer’s emotions toward a brand. It indicates the company’s strength and performance, specifically in the public markets. It is the additional value that a product receives due to its ‘well-known’ stats or also called brand awareness.
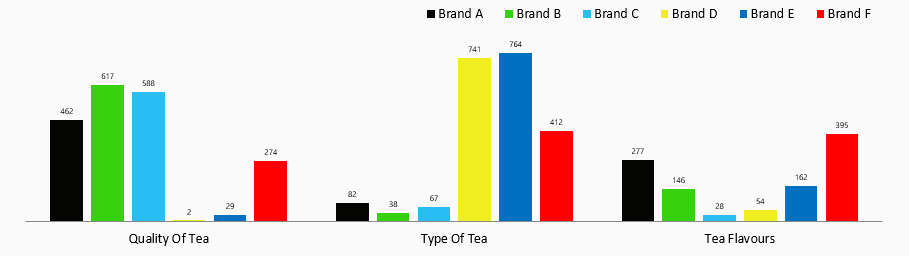
With the help of Brand equity, companies gain a competitive advantage that results in higher sales, higher revenues, and lower costs. Learning about a competitor’s products and services through category analysis provides insights into their value. This helps reveal how businesses can differentiate their products to provide additional value.
Below is a category analysis for a tea brand (Brand A) that compares the performance of 5 other brands based on the product category drivers – quality, type, and flavors. With this report, Brand A can easily identify that it is not offering many types of tea, which is its weak point compared to its competitors. This can lead to building a better product strategy for Brand A.
What Are The Data Sources For Category Analysis?
Before you start category analysis, you need to have the raw data, without which you can’t analyze anything. The raw data that is used will ultimately decide the accuracy and depth of the category analysis outcome. Data can be sourced from primary and secondary sources and internal and external sources. For a detailed and accurate picture of your analysis, it is better to use a wider variety of sources.
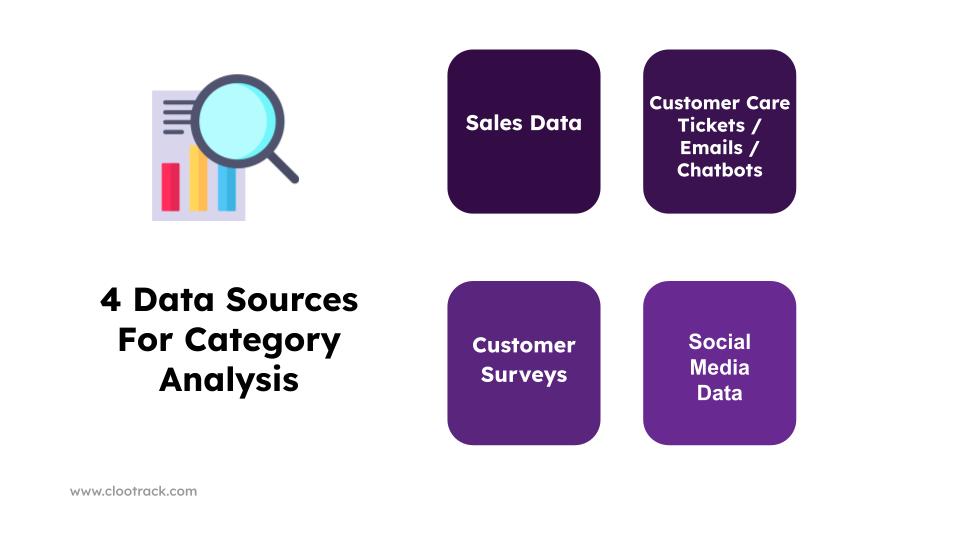
Here we will talk about the different sources that are used for performing category analysis:
1. Sales Data
Sales data is information about sales performance that is recorded and easily available to the sales team. Many companies have enormous databases of historical sales data, but how many brands invest time and money to mine the intelligence hidden in those databases?
Your in-house sales data can be the starting point for the product category analysis. It could be used to analyze the patterns and trends year on year. With sales data, it is possible to pinpoint new opportunities to grow your business. Monthly or quarterly sales data offers a chance to drill down into the performance of certain categories or specific products.
With sales data, you can obtain details on a specific product category and customer trends for that category. Sales data can be applied to obtain more granular details such as:
-
Sales of Product categories
-
The trend in sales of each product category
-
Gross margins of each product category
With the sales data, product categories can be analyzed to find the areas of strength and weakness, identify the products that are producing the least and the greatest volume, and the customers who furnish the best product sales results. Sales data enables a company to concentrate its sales efforts, thereby bringing in the greatest return.

A good example of a company that conducted product category analysis is Hunt Foods – in a period of 11 years, it reduced its product lines from 30 items to 3 items – but yet was able to increase sales from $15 to $ 120 million.
With the help of product category analysis, weak products can be eliminated, and focus can be diverted to strong ones, thereby increasing its profit substantially.
2. Customer Care Tickets / Emails / Chatbots
Much data comes from customer support interactions – enough to pull product insights, discover emerging trends, and improve brand perception.
Internal data to the company, such as customer care tickets, customer emails, and chatbot conversations, are the best records of your customer issues and pain points.
People who are involved in sales, managing accounts, and answering customer queries will have firsthand data relating to a product. The customer care tickets, when analyzed, can offer deep insights into customer reaction and their perception of your brand.
When each customer ticket is resolved separately and closed on time, there is not much attention given to the problem – but when thousands of tickets are analyzed, the product insights derived are of great value to product managers.
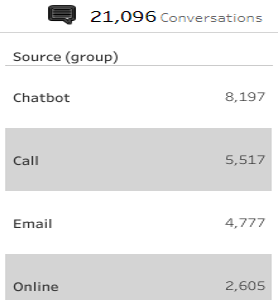
For instance, see how Clootrack analyzed 21,096 conversations of a Brand from their internal data sources such as online forums, emails, and chatbots.
One of the customer said “I am 74 years old and i positively require a hard copy of the electricity bill to be sent to me as soon as possible”.
To the surprise of the CMO of this company, customers were frustrated that they were not receiving the hard copies of their bills – which was not something that the CMO expected. Product category analysis using internal data can be an eye-opener many a time.
While the customer service data may only suggest what’s going on between your customer service agents and your customers, it’s important to analyze the data as a whole and be able to spot product improvements and trends quickly.
3. Customer Surveys
Though a very traditional data collection method, it can be effective as it is very specific to a particular product category.
Data collected using surveys is comprehensive and is gathered from a target audience about a particular topic of interest. Starting from face-to-face surveys, telephonic surveys, online surveys, and email surveys, the data collection using surveys has changed.
Surveys offer qualitative and quantitative insights to understand consumer views about a product on a larger scale.
Isabel Isidro, the head of marketing for The Cardinal Classic Figure Skating Competition, shared how surveys have helped their team create ice skating competitions using the category drivers.
“The feedback is critical in shaping how we organize the next competition. It helps us determine what worked, what we need to change, and how we can improve.”
Surveys can extract super-specific feedback but often are very laborious and time-consuming.
4. Social Media Data
Social media data refers to the data that is collected from social media networks where users share their opinions and views relating to a product that they purchased.
With many brands on social media, it is now possible to gather social intelligence through various techniques, such as Artificial Intelligence. Social data allows the granulation of the data by segmentation, either manually or with the help of automation.
What prodded Netflix to think about a streaming service? How did Starbucks plan to launch a pumpkin-spiced latte that could face new competition in maple pecan? What made Kraft drop preservatives from its mac-n-cheese and the big brand Pepsi to do away with artificial sweeteners?
If any of the above companies had not looked into their social media conversations – then probably none of the above new products or product changes would have happened.
Companies listened to their customers on social and picked up on clues – to incorporate the changes to their products and product categories.
Wrapping Up
Your product category analysis process should ultimately provide your organization with useful insights and a solid strategy for decision making. A deeper understanding of product categories is vital as it helps reveal customer preferences, discover needs not being met, and shed light on prospects for growth and innovation.
Having a comprehensive product category analysis process equips your organization with the tools needed to succeed in competitive markets. The insights gained about current market trends, competitor strategies, and customer perceptions all fuel the strategic plan of the organization.
In conclusion, a product category analysis process is much more than just a collation of data. It's the bridge that connects raw information to actionable insights, ultimately leading your organization down the path of informed decision-making and success. So, get ready to dive deep into analysis, understand your market better, and let this knowledge guide your business decisions.
Read More: How to Build Best-in-Class Customer Experience in Energy Drinks Industry